
Container Yard Management: The True Cost of a Reshuffle
- Posted On: October 12, 2026
- Post Comments: 0
Every terminal performs moves it never bills for. A box has to come off the top to reach the one underneath, and that lift consumes equipment, fuel, an operator and usually a waiting truck. Container yard management exists largely to reduce those moves, yet very few terminals know how many they perform or what each one costs. This article gives you a way to count both using data you already have, alongside the wider yard series.
Key Takeaways
- A reshuffle is any lift performed only to reach another container. It generates no revenue and consumes equipment hours, fuel, operator time and often truck waiting time.
- Most terminals can estimate their reshuffle rate from existing move records by counting lifts that return a container to the yard rather than delivering it anywhere.
- The cost per reshuffle is best built from your own equipment hourly rate rather than an industry figure, because equipment mix and labour cost vary enormously by region.
- A meaningful share of reshuffles are caused by inaccurate inventory rather than by poor planning, which is why data quality and reshuffle reduction are the same project.
What Counts as a Reshuffle and Why It Is Invisible
A reshuffle, or unproductive move, is a lift performed purely to gain access to a different container. The box being moved is not going anywhere. It comes off, waits, and goes back, or lands somewhere else that will need correcting later. Nothing about the operation earns revenue.
It is invisible for a structural reason. Terminals count moves, and a reshuffle is a move, so it appears in productivity statistics as work performed rather than as work wasted. A yard doing a great deal of unnecessary lifting can look busy and productive on a monthly report.
It is also distributed. No single reshuffle is expensive enough to notice, and they happen across every shift and every block, which means no individual has a view of the total. The cost is real and nobody owns the number.
The causes divide into two groups that need different remedies. Planning causes are boxes placed without regard to likely departure order, mixed dwell times in one stack, and blocks worked in an order that fights the plan.
Data causes are boxes that are not where the record says they are, so the machine goes to the wrong row and works its way through a stack looking. These are usually undercounted because the operator experiences them as a slow retrieval rather than as a data error.
Separating the two matters commercially. Planning causes respond to better allocation policy. Data causes respond only to better observation, and no amount of algorithmic sophistication will fix a yard whose picture of itself is wrong.
Good container yard management therefore begins with classification rather than with a solution. Until you know what proportion of your unproductive moves came from placement decisions and what proportion came from searching, you cannot tell whether you have a planning problem or a data one, and the two carry very different price tags.
Counting Your Own Reshuffle Rate
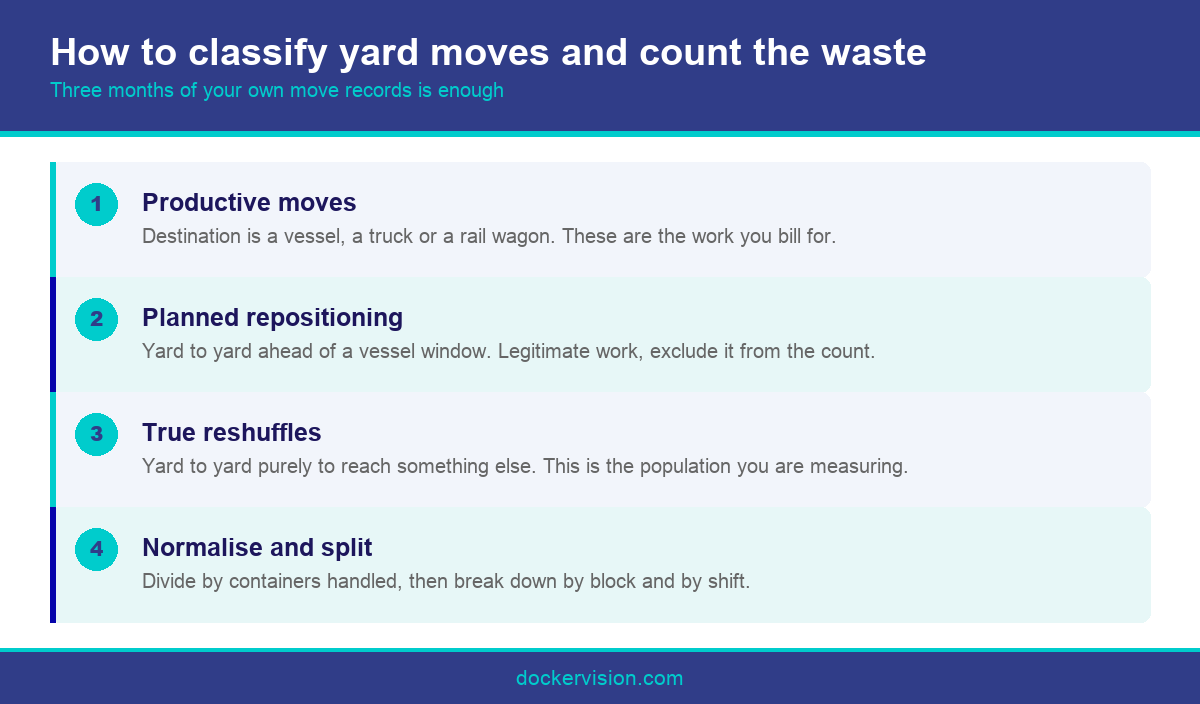
You almost certainly have the raw data. Every completed move in your operating platform carries an origin, a destination and a reason code. A move whose destination is another yard position rather than a vessel, a truck or a rail wagon is a candidate reshuffle.
Extract three months of move records and classify them that way. Yard to yard moves are your starting population, though not all of them are unproductive, since planned repositioning ahead of a vessel is legitimate work that should be excluded.
Divide the remainder by the number of containers handled in the same period to get reshuffles per container. This normalisation matters because raw counts move with volume and tell you nothing about whether your yard is improving.
Then break the figure down by block and by shift. Almost every terminal finds that a small number of blocks account for a disproportionate share, usually the ones with the most mixed dwell times or the worst inventory accuracy, and that is where intervention pays first.
Finally, look at the distribution rather than the average. A yard averaging a modest rate with a weekly spike during vessel windows has a sequencing problem. One with a steady elevated rate across all shifts has a placement or data problem.
Do this once and you will have a baseline that every subsequent improvement can be measured against, which is worth more than any benchmark figure taken from another terminal with a different layout and a different cargo profile.
Building a Cost Per Reshuffle From Your Own Numbers
Start with the equipment. Take the fully loaded hourly cost of the machine that performs the lift, including depreciation, maintenance, fuel or power, and the operator. Divide by the number of moves that machine performs in an hour to get a cost per move.
Then add the second order costs. A reshuffle during a truck transaction adds waiting time at the other end, and that time has a value to your customer even when it does not appear on your own cost base. Terminals that ignore it understate the case for fixing the problem.
Add congestion cost where it applies. During peak windows the machine performing an unproductive move is not available for a productive one, so the real cost is the value of the displaced work rather than the operating cost of the lift. This is the same reasoning behind capacity utilisation analysis anywhere else in an industrial operation.
Multiply your cost per reshuffle by your annual reshuffle count and you have an annual figure. It is usually larger than expected, and it is defensible because every input came from your own operation rather than from a vendor slide.
Sense check it against a second route. Estimate the equipment hours consumed by unproductive moves and express them as a fraction of your total equipment hours. If that fraction is material, the figure is real and the opportunity is real.
This is the number that funds a yard programme. It converts a vague sense that the yard is inefficient into a budget, and it gives finance something to compare an investment against, which is the point at which projects stop stalling.
Reducing Reshuffles Without Rebuilding the Yard
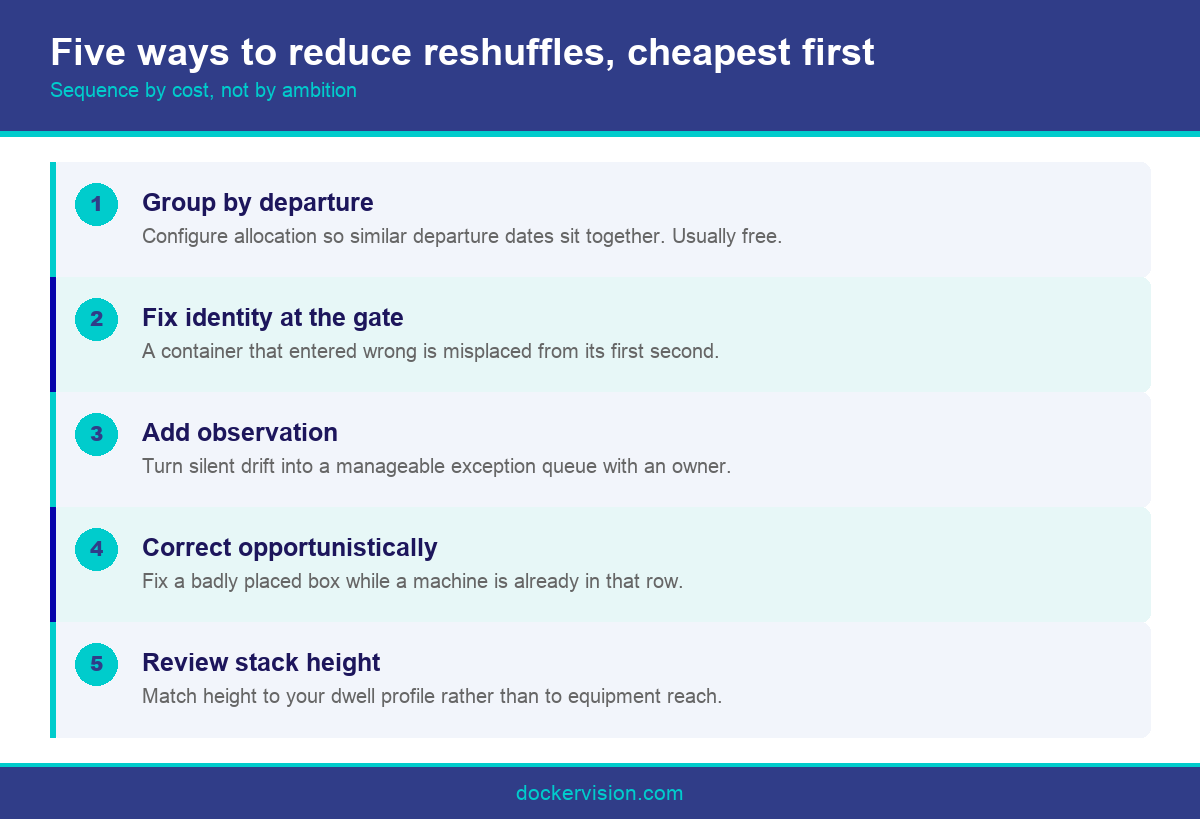
The cheapest intervention is grouping by departure. Boxes likely to leave together should sit together, and boxes with long dwell should not sit on top of boxes with short dwell. Most platforms support this and many terminals have never configured the policy.
The second is fixing identity at the gate. A container that entered under the wrong number is misplaced from the moment it arrived and will generate reshuffles until somebody finds it. Gate accuracy is the foundation of yard accuracy, as our piece on why manual gates stop scaling sets out.
The third is observation. Adding an independent check on where containers physically are turns invisible drift into a manageable exception queue, and it removes the class of reshuffles caused by searching rather than by planning.
The fourth is opportunistic correction. When a machine is already working a row, moving a badly placed nearby box costs almost nothing. Systems that surface those moments recover value that a pure planning approach never sees.
The fifth is stack height discipline. Higher stacks are more space efficient and generate more reshuffles, and the right height depends on your dwell profile rather than on what the gantry crane can physically reach. This trade is worth modelling against your own dwell distribution rather than assuming a house rule is still correct.
Sequence these by cost. Policy configuration is free, gate accuracy is inexpensive and fast, observation is a software addition where cameras exist, and only then does anything structural deserve consideration.
Conclusion
Reshuffles are the clearest measurable waste in a container terminal and the least measured. Classify three months of your own move records, build a cost per lift from your own equipment rates, and split the causes between planning and data. Terminals that do this usually find the data half is larger than they expected, and cheaper to fix. Ask Docker Vision about a reshuffle audit using your existing cameras.
Frequently Asked Questions
What exactly counts as a reshuffle?
A reshuffle is a lift performed only to reach a different container. The box being moved is not being delivered anywhere, so the terminal spends equipment and operator time on work that earns no revenue and was not requested by any customer.
How do we count reshuffles from our existing data?
Extract three months of completed moves and isolate those whose destination is another yard position rather than a vessel, truck or wagon. Exclude planned pre vessel repositioning, then divide the remainder by containers handled in the period.
What is a reasonable reshuffle rate?
There is no universal benchmark, because layout, dwell profile and stack height differ so much between terminals. Your own trend over time is far more meaningful than any published figure taken from a terminal that does not resemble yours.
How much does one reshuffle cost?
Build it from your own fully loaded equipment hourly rate divided by moves per hour, then add truck waiting time and, during peak windows, the value of the productive move that machine could not perform instead. Vendor averages understate it.
Are reshuffles caused by bad planning or bad data?
Both, and the split matters. Planning causes respond to allocation policy changes. Data causes, where the box is not where the record says, respond only to independent observation, so treating them as one problem produces half a solution.
Can we reduce reshuffles without buying anything?
Often yes, at least partly. Grouping containers by likely departure, avoiding mixed dwell times in a single stack and reviewing stack height against your dwell profile are policy changes most platforms already support but few terminals have configured.
Does a taller stack always mean more reshuffles?
Generally yes, and it also means better space efficiency, so the right height is a trade rather than a rule. Model it against your own dwell distribution instead of stacking to whatever height the equipment can physically reach.
What is opportunistic repositioning?
It is correcting a badly placed container while a machine is already working that row for another reason, so the marginal cost of the correction is close to zero. Surfacing those moments recovers value that scheduled optimisation never captures.
Where should a terminal start?
Count the current rate by block and by shift for one month without changing anything, so you have a baseline. Then fix gate identity first. Our guide to container number recognition explains why that comes before anything else.

Leave A Comment