
Automation in Ports Across India: The 2026 Position
- Posted On: November 12, 2026
- Post Comments: 0
National statements about port modernisation are easy to find and hard to act on. What a terminal operator needs is a layer by layer picture of where automation in ports has genuinely reached across India, which parts are now standard, which are still rare, and what the gap costs. This article gives that picture and sets out what a mid sized operator can realistically achieve in the next three years, measured against how modern container terminals have changed.
Key Takeaways
- Gate and crane recognition are the layers where Indian adoption is furthest advanced, and even there coverage is uneven between terminals inside the same port.
- Document automation lags behind identity automation despite the paperwork burden being heavier here than in most comparison markets.
- Yard positioning and equipment health monitoring are the two largest untouched opportunities at Indian terminals of every size.
- Full yard automation remains rare and is unlikely to spread quickly, because the labour arithmetic that drove it elsewhere does not hold in the same way here.
Reading the National Picture Layer by Layer
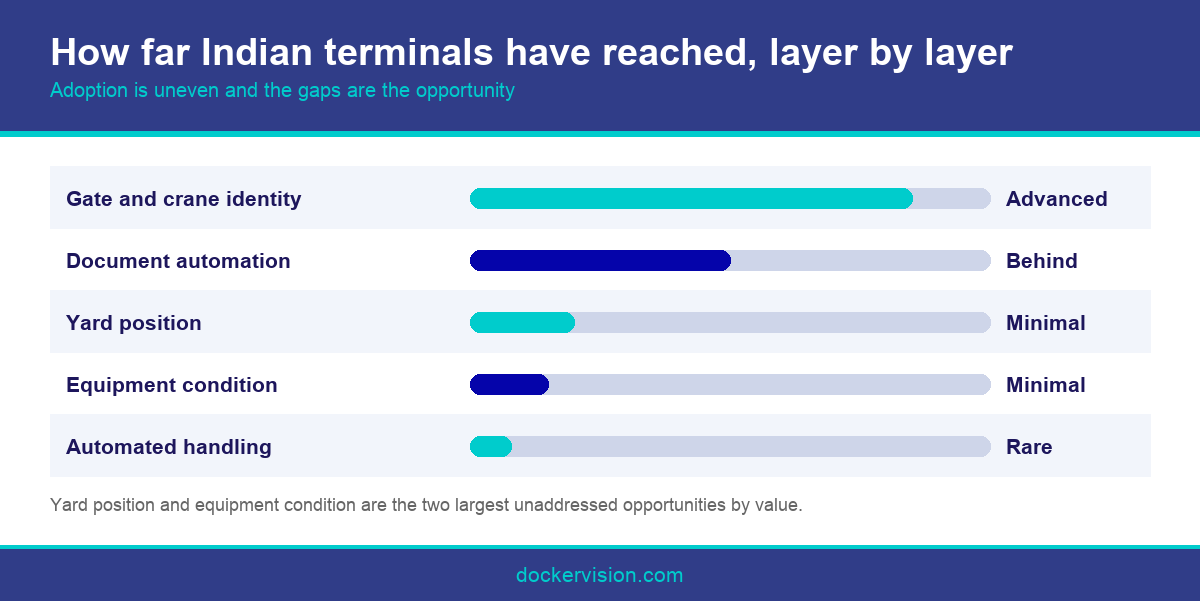
Talking about a port as automated or not automated is unhelpful, because automation arrives in layers and a single facility can be advanced in one and untouched in another. The five layers worth assessing separately are identity, documents, yard position, equipment condition and physical handling, and Indian terminals sit at very different points on each.
Identity is the most advanced. Gate recognition of container codes and vehicle number plates has spread steadily across the larger terminals, driven by truck turn time pressure and by the visible cost of keying errors. Adoption is still uneven, and it is common to find one terminal inside a port automated and its neighbour still keying by hand.
Documents are behind identity, which is surprising given how paperwork intensive Indian terminal operations remain. Delivery orders, customs paperwork and interchange receipts still move as paper in many facilities, and the delay and dispute that creates is absorbed as a normal cost of doing business rather than treated as addressable.
Yard position is largely untouched outside the newest facilities. Most terminals rely on reported moves, accept a level of inventory drift, and manage the consequences through search effort and conservative planning. This is the single largest unaddressed opportunity in the country by value.
Equipment condition is similarly open. Maintenance at most Indian terminals remains a mixture of preventive intervals and reaction to failure, with very little predictive instrumentation, despite operating conditions that are unusually hard on machinery.
Physical handling automation is rare and concentrated in the newest capacity. That is not a failure of ambition, it is a rational response to the labour and land economics that apply here, and it is unlikely to change materially in the next three years.
Why Adoption Is Uneven Within a Single Port
Most large Indian ports contain several terminals operated by different companies under concession arrangements, and each operator makes its own technology decisions. A port is therefore an address rather than an operating unit, and national statistics about it can mask enormous internal variation.
That structure explains a great deal of the unevenness. An international operator running one terminal will apply its group standards, while an independent operator next door makes decisions against its own balance sheet and its own concession horizon, which are entirely different constraints.
Concession length matters more than it is usually credited. An operator with eight years remaining evaluates a five year payback very differently from one with twenty five, and that alone explains some of the apparently puzzling gaps between facilities of similar size and volume.
Customer mix is another driver. A terminal serving shipping lines with demanding service level expectations feels turn time pressure directly, while one serving a more captive customer base feels it later. Automation tends to follow the pressure rather than the opportunity.
Capital access differs too. Group owned terminals can draw on balance sheets that independent operators cannot, which pushes independents toward incremental, self funding automation and away from anything structural. That is a constraint, and it also happens to be sound sequencing.
The practical implication for a terminal operator reading benchmarks is to compare against facilities with a similar ownership structure, concession horizon and customer mix rather than against the largest name in the same port. The comparison is otherwise misleading in both directions.
What the Gap Costs Right Now
The identity gap costs truck turn time and keying errors. Every manually entered container number carries a well documented error rate, and each error becomes a misdelivery, a search or a dispute somewhere downstream, usually at a point far removed from where it was created.
The document gap costs dwell. Paperwork that moves at human speed holds cargo in the terminal longer than the physical operation requires, which consumes yard capacity and delays revenue recognition. Our piece on customs paperwork delays quantifies that mechanism.
The yard position gap costs search effort, unproductive moves and reserved capacity. Planners hold space back because they know the record is imperfect, and that reserve is physical area the terminal has paid for and is choosing not to use.
The equipment gap costs unplanned downtime, and it costs most during exactly the periods when downtime is least affordable. A crane that stops during a vessel window has a cost measured in berth hours rather than in repair cost, which is a distinction few maintenance budgets reflect.
None of these appear as a single line in a management report, which is why they persist. Each is absorbed into a different departmental number, and no one person sees the total, so the aggregate case for addressing them is never assembled.
Assembling it is the most useful analytical exercise available to an Indian terminal in 2026. Count search events, count keying corrections, count paperwork delay hours and count unplanned equipment stoppages for one quarter, and the priority order usually becomes obvious without further analysis.
What Is Realistically Achievable in Three Years
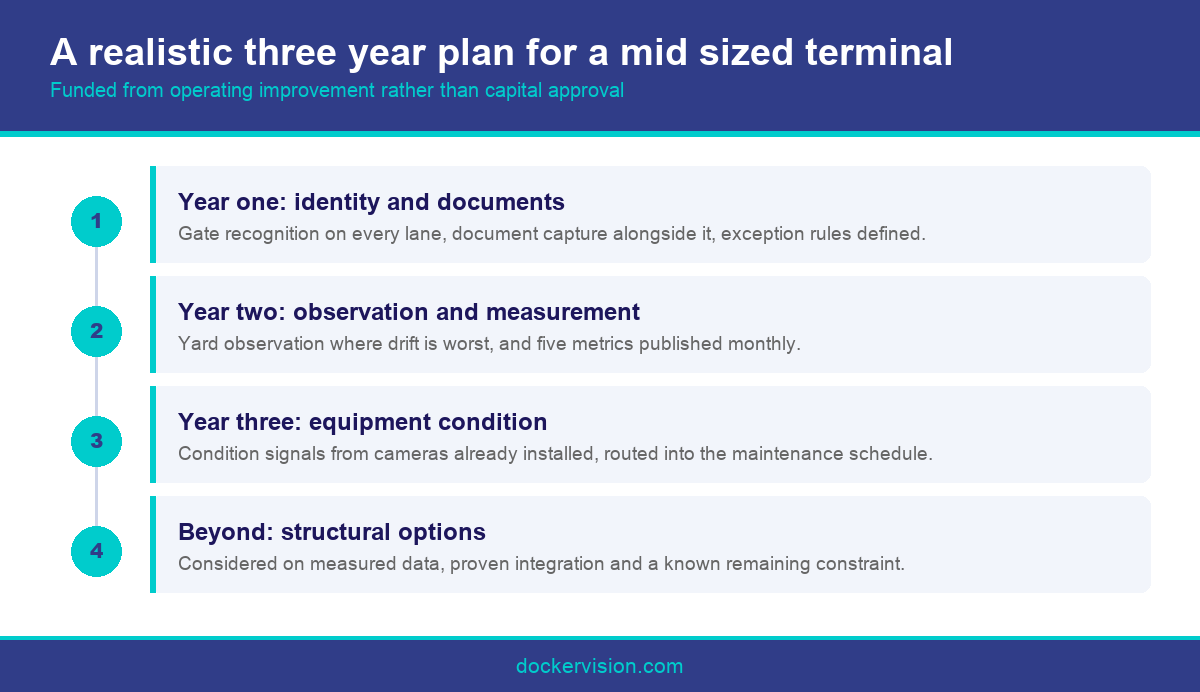
Year one should close the identity gap completely. Gate recognition on every lane, integrated into the operating platform with defined exception rules, is achievable within months rather than years and does not require capital approval on the scale that stalls larger projects.
Year one should also start document capture, because the two share infrastructure and the paperwork burden in Indian terminals is heavy enough that the return is quick. Running both together is more efficient than sequencing them, since the integration work overlaps substantially.
Year two should address yard position where drift is worst. This does not mean instrumenting the whole yard. It means identifying the blocks that generate most search events and adding observation there, then extending as the exception queue proves its value.
Year two should also establish measurement as a habit. Publishing turn time, search events, unproductive moves and unplanned equipment hours monthly changes internal conversations more than any single technology does, because it makes the invisible costs visible to the people who can act.
Year three should bring equipment condition into scope, using camera feeds already installed rather than a separate sensor programme. Terminals operating ageing equipment in a hot saline environment have more to gain here than most, and the marginal cost is low once the cameras exist.
Structural handling automation belongs beyond that horizon for most operators, and by the time it is considered the terminal will have measured data, proven integration and a realistic view of where the remaining constraint actually sits, which is exactly what a capital case needs. Our overview for competitive terminals covers the wider market context.
Conclusion
Automation in ports across India is advanced in identity, thin in documents and largely absent in yard position and equipment condition. That distribution is the opportunity. A mid sized terminal that closes the identity gap this year, adds document capture alongside it, addresses yard drift next year and instruments equipment in the third will have changed its operating economics without a single structural project. Ask Docker Vision where your gaps are.
Frequently Asked Questions
How automated are Indian ports in 2026?
It varies by layer rather than by port. Gate and crane identity recognition is the most widely adopted, document automation lags, and yard position and equipment condition monitoring remain largely untouched outside the newest facilities.
Why do two terminals in the same port differ so much?
Because most large Indian ports contain several terminals run by different operators under separate concessions. Each one makes its own technology decisions against its own balance sheet, its own customer mix and its own remaining concession horizon.
Which automation gap costs Indian terminals the most?
Yard position, by value, because it drives search effort, unproductive moves and the reserve capacity planners hold against uncertainty. It is also the layer where adoption is lowest, which makes it the largest available opportunity.
Why is document automation behind identity automation?
Largely inertia. Paperwork delay tends to be absorbed as a normal cost of doing business rather than measured as an addressable one, even though Indian terminal operations are considerably more document intensive than most of the comparison markets.
Will full yard automation spread quickly in India?
Unlikely in the next three years. The labour arithmetic that drove adoption in high wage markets does not apply the same way here, and most Indian container capacity is already built, which makes conversion disruptive and expensive.
What should a terminal measure before deciding anything?
Search events, keying corrections, paperwork delay hours and unplanned equipment stoppages, counted across one full quarter. Those four numbers usually make the priority order obvious without any further analysis or any external benchmarking exercise at all.
How long does closing the identity gap take?
Months rather than years for a terminal of moderate size. The installation itself is short, the integration work is well understood, and the capital involved rarely reaches the approval threshold that tends to stall larger infrastructure projects.
Should identity and document automation run together?
Usually yes. They share infrastructure and much of the integration work overlaps, so running them as a single programme is more efficient than sequencing them, and the combined benefit is considerably easier to justify internally.
What does a realistic three year plan look like?
Identity and documents in year one, yard observation and measurement discipline in year two, and equipment condition in year three. Our overview of AI trends in terminal operations covers what else changes around that plan.

Leave A Comment